Data Visualization - Best Practices Guide
Bereich: Whitepaper
 Everybody expects their Business Intelligence (BI) and analytics solution to turn data into insights. But your data is only as good as your ability to understand and share it.
This guide to best practice data visualization will walk you through how to:
1. Choose the right chart type: Communicate the significance of your data in the most efficient way possible
2. Optimize your charts: Improve information absorption
3. Share your insights: Turn information into action
Effectively transform your organizational data into easily digestible and actionable business communications.
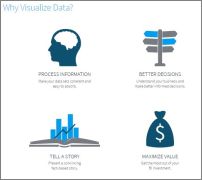
- Data Visualization Best Practices - Why visualize data?
- Choose the right chart type - Tell the story in your data
- Format style - Make your charts easier to understand
- Add clarity - Tell people exactly what your charts represent
- Direct attention - Highlight what’s important
- Share - Unlock the value of your data by sharing your insights
- About Yellowfin - Additional resources
Bereitgestellt von:
Yellowfin